Monitor a run
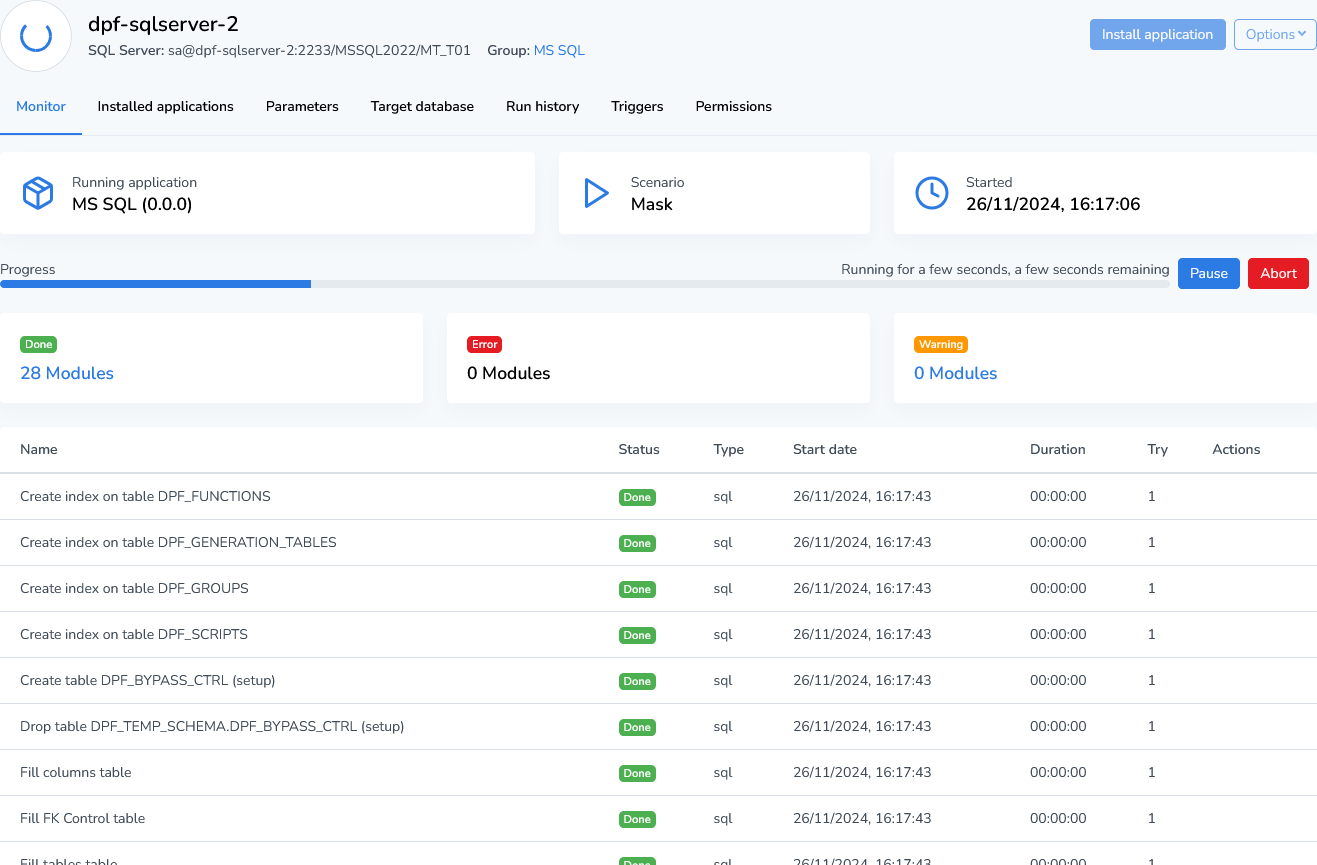
The Monitor tab gives an overview of the running scenario of a certain application. If the same scenario has been executed before, it will try to estimate the remaining time of the run. Down below you will get an overview of the all the running modules and modules that have been recently completed.
Errors
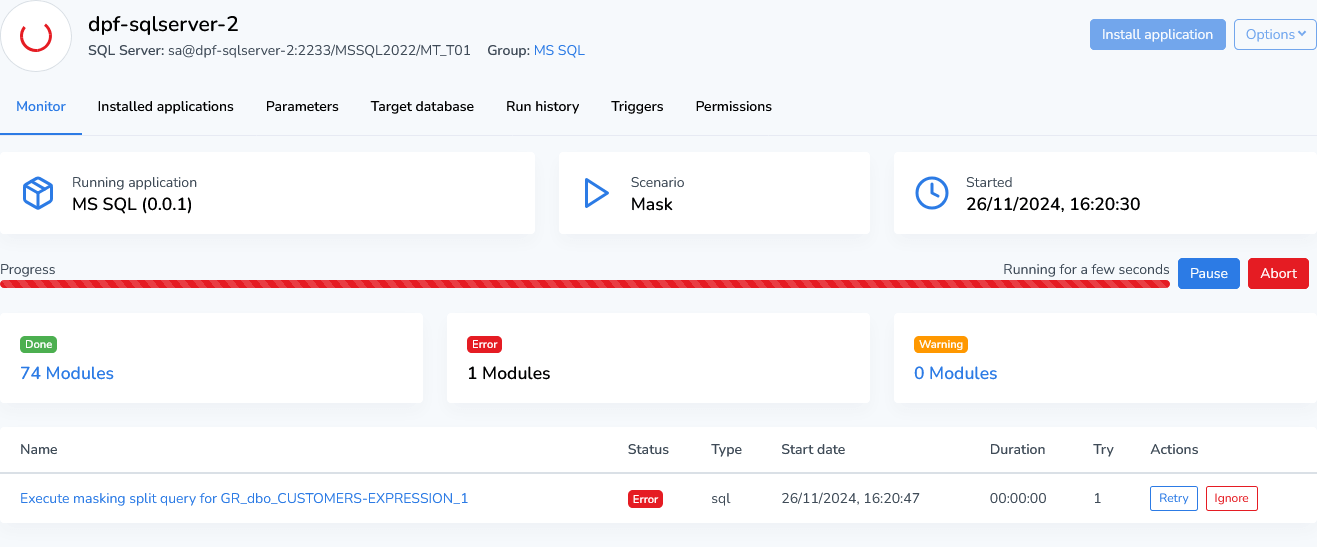
When an error occurs, the progress bar and running indicator turn red. The affected module will also display a red error badge in the status column. You can choose to retry or ignore the module. If multiple modules encounter errors, you have the option to retry or ignore all at once.
To view detailed error information, click the name of the affected module to access the logs and executed code.
Error Details
In the Logging tab, you can view the detailed logs of the executed module. In most cases, errors appear near the last few lines. You can also review the executed code.
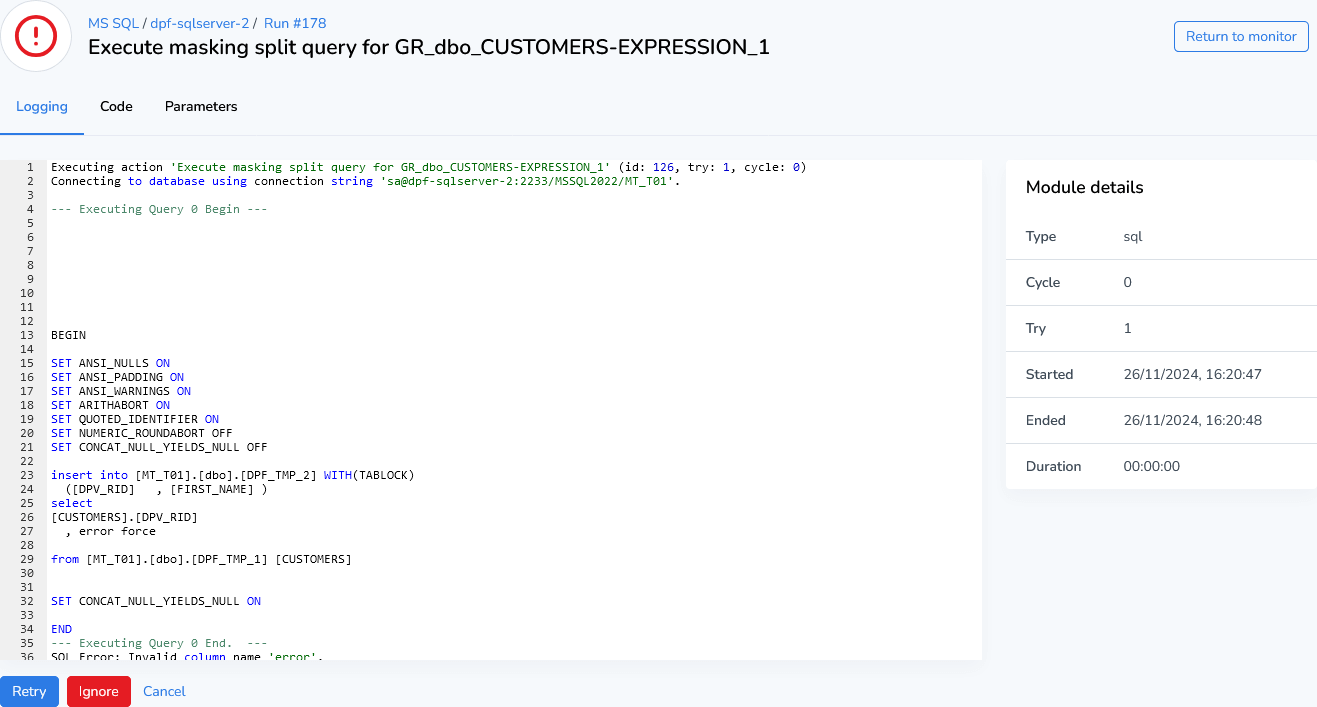
In some cases, it's possible to fix errors while the scenario is still running. For example, database-related issues can be resolved directly in the database, allowing you to retry the errors. In other situations, changes to the code may be required.
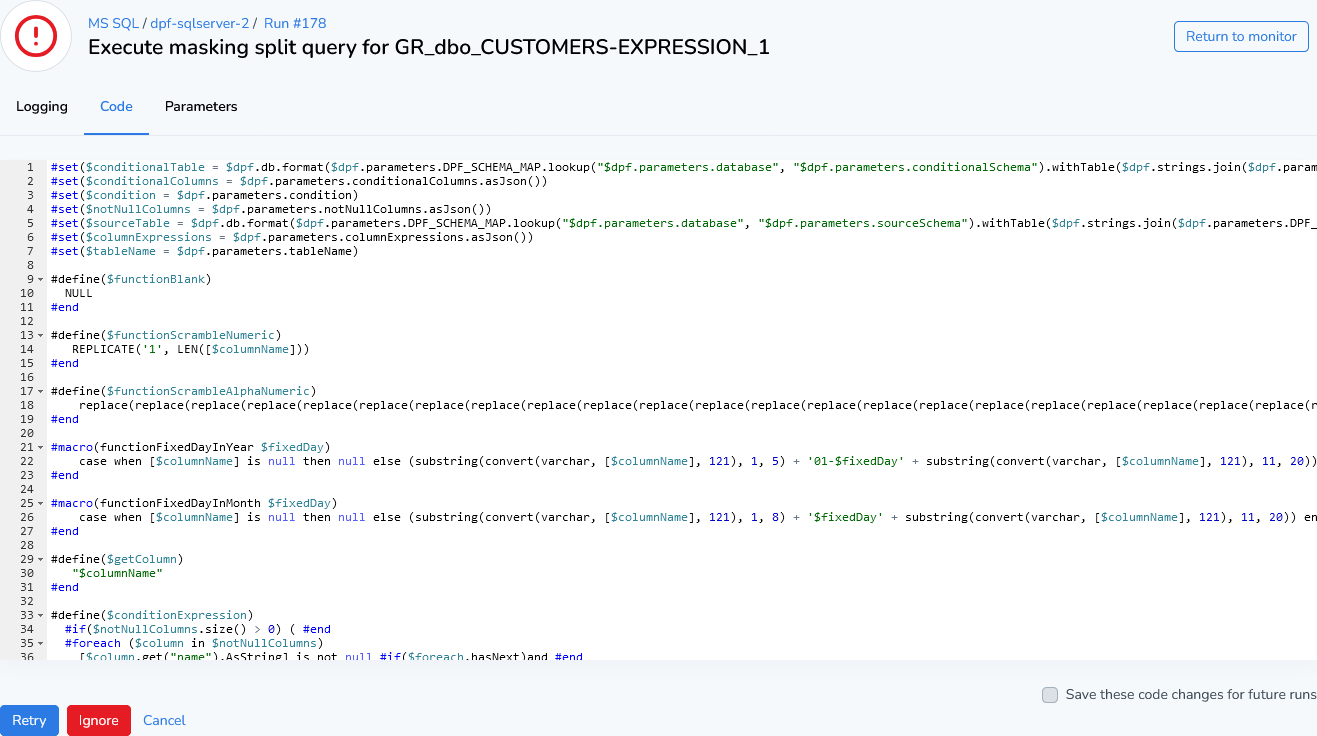
In the Code tab, you can modify the code, save your changes, and retry the affected module.
Note: These changes apply only to the current run. To make them permanent, you must update your application with a version that includes these fixes.
If you want these changes to apply to all future runs, enable the "Save these code changes for future runs" option. However, if you upgrade or reinstall the application, these changes will be lost unless they are also applied to the template.