Starting and monitoring a run
Let's take a look at whether your installation was succesful or not, and if we are able to run the template you've built.
- Go back to the Runtime Dashboard
- Decide which of the installed applications you'd like to attempt running.
- Click on 'Start...'.
- Depending on whether you've selected a Subset or Privacy template to execute, one of two option menus will pop-up.
- For Subset templates there are four options to deploy. To learn more about what the various options mean, please refer to the DATPROF Subset training or manual. For now, select (Re-)Fill.
- For Privacy templates there should be only one option. Select 'Mask' to start the run.
Live Monitoring
All going well we should see a stream of data being generated on the screen. Runtime shows statistics on completed modules, and errors as they happen during the run.
This is a useful feature, as any errors that get thrown up in real-time are quickly identified, preventing down-time.
Post-Run documentation
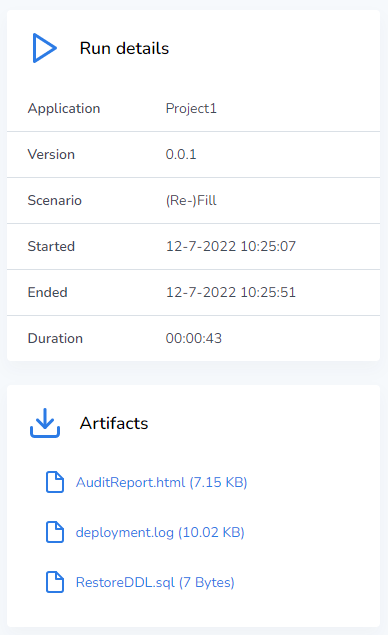
If a run finishes correctly the user interface will alter slightly, and you should see a short summary of the run and the artifacts added to the right side of the screen.
The artifacts are a group of documents detailing and logging the run's actions. These are useful tools, as they can provide developers with information on how the run has progressed, alongside any potential errors or warnings with their verbose error messages.
Checking past runs
After finishing a run, the run's statistics and documents get added to the 'Runs' tab. It's possible to find all the information as presented in the previous step, and to refer back to previous runs.