Troubleshooting the JVM process
Below article involves advanced troubleshooting. This should generally only be done in coordination with DATPROF, as interpreting the JVM’s statistics can be tricky or lead to false conclusions.
During run execution, it’s possible that the user experiences slowdowns due to for instance memory usage, or CPU throttling.
For more information about a run, it’s always possible to check out the actual JVM process. This can give some insight on what’s happening with memory management, the garbage collector and CPU usage. Certain patterns in this behavior might indicate problems.
To get started, you’ll need any tool that allows you to attach to a JVM process. This can for instance be Java’s own Jconsole or a tool like VisualVM. For this example I’ll be using VisualVM.
Attaching to a java process
After installing and booting up VisualVM you’ll see all of the various Java processes running in the left-hand index. To continue, select the process you’d like to inspect. For our applications this will generally follow this naming convention:
com.datprof.runtime.agent.RuntimeAgent (pid <INTEGER>)
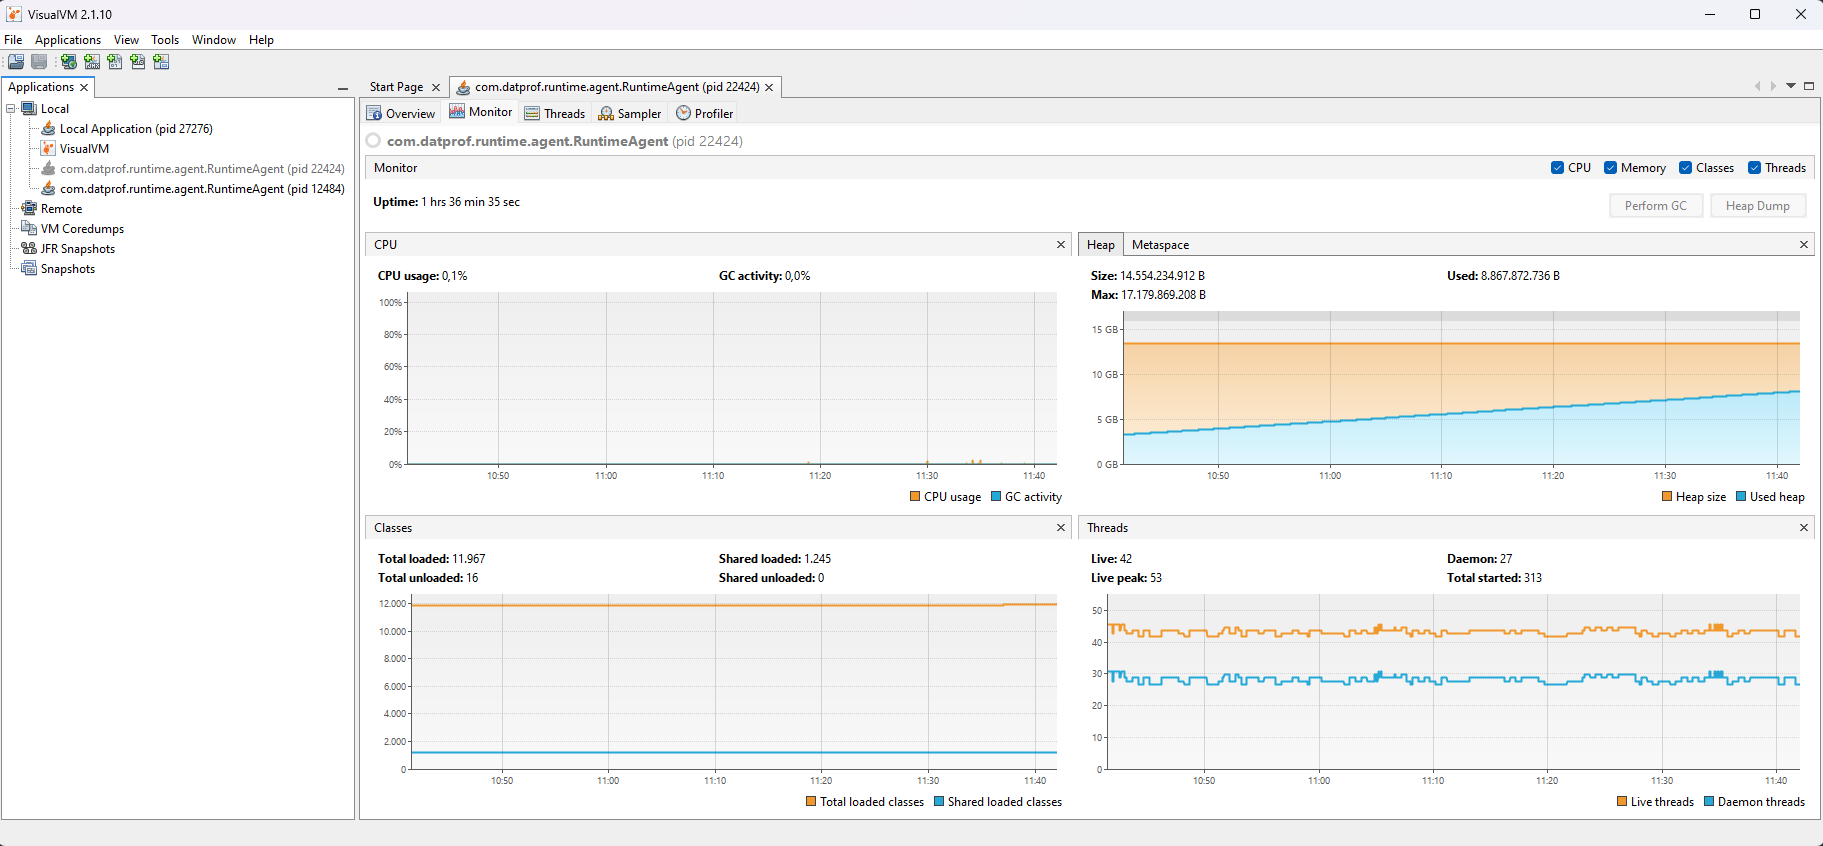
Once you do, you’ll see an overview that looks something like the one below this paragraph. There are two main things we’re interested in here, the CPU Statistics and the Heap Statistics

Heap Statistics
Heap is the amount of system memory the JVM process reserves and uses at any given time. When running our tools it can be interesting to look at some of the following when experiencing performance slowdowns:
Does the current heap size reach the maximum heap size? If so, this may suggest the JVM needs to be assigned more RAM or something is causing the process to use abnormal amounts of memory.
Are there certain patterns in memory usage? If memory usage severely spikes and then goes down again, this may indicate that certain processes are unnecessarily stressful (such as specific masking functions taking up an unreasonable amount of memory.
Is the max heap size shown here much less than what you’d expect Privacy to use? If so, this may mean you need to manually overwrite some of the Java environment variables to allow the JVM to use up more RAM, which may improve performance.
Increasing RAM allowance for the JVM doesn’t always lead to a performance improvement! It’s possible that this actually decreases performance due to how the garbage collector (described below) works.
CPU Statistics
The CPU statistics are interesting as they give us an insight into how stressed the JVM is. If the CPU usage is stuck at 100% this may mean that either the system specifications are unable to cope with the functions being executed or something is causing the CPU to throttle.
Aside from this, the CPU statistics also show how busy the garbage collector (GC) is. The GC performs the duty of periodically scanning the heap to make sure that processes which have reserved memory and no longer require that memory release the memory, making it available for new processes to claim.
If the garbage collector is very busy this may mean you’ve allocated too little RAM to the JVM. The behaviour this provokes is that the garbage collector will constantly look for places to make memory available, which is very inefficient. This is usually paired with a performance slowdown.
If the user assigns a lot more RAM than necessary to the JVM, it’s possible that the garbage collector does not scan the heap for long periods of time, allowing memory to fill up. If the garbage collector then does scan, it has to scan a very large amount of memory all at once, which may cause a performance slowdown.
