Once all the connection data has been configured and profiles have been defined, we can move on to the main functionality of Analyze; the Analyze tab. In this part of the application the user can specify analyze functions on the columns of the imported metadata and Analyze the data in the database.
On the left side of the window, you will see the imported tables or views. The right side displays the details and statistics for the selected table or view.
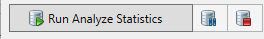
To analyze one or more tables or views, click the Run Analyze Statistics button located at the bottom left of the window.
There are three icons giving you 3 options.
From left to right:
Run Statistics: The Analyze run will start.
Pause Statistics: The run will pause, a pop-up will appear. To continue press "OK".
Abort Statistics: The analyse run will abort.
To run statistics a connection to the database is required.
Saving your project
After collecting statistics for your tables, it is recommended to save your project. Since gathering statistics can be time-consuming, saving the project allows you to skip this step when reopening it, unless you choose to collect statistics again.
Tables and views
On the left side of the screen the imported tables and views are shown.
From top to bottom:
Search Box: Allows you to filter the tables or views displayed.You can use % as a wildcard.
Schema Drop-down Menu: Contains all available schemas, shown only if more than one schema is imported.
Tables and Views: These are displayed with the following icons:
for tables
for views
You can select one or more tables at the same time to perform actions on them collectively.
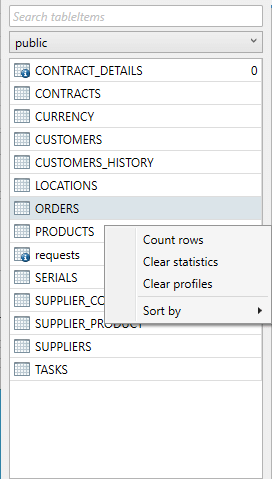
Right-click on a table or view to open a menu with the following options:
Count Rows: The row count will appear next to the table or view name.
Clear Statistics: Clears statistics, including row count, from the selected tables or views.
Clear Profiles: Clears the matching profiles for the selected tables or views.
Sort By: Sorts the tables by object name, object type, or row count.
Analyze Functions
The right side of the screen features four distinct tabs: Statistics, Profiling, Data, and Foreign Keys. These tabs represent the core functionalities of the Analyze tool, each designed to provide valuable insights into the database you're analyzing.
Statistics: Provides statistical data for the selected tables or views, analyzing only those that you choose.
Profiling: Offers advanced capabilities that enable users to assess data quality, identify specific patterns or data types, and detect statistical outliers. Profiling can help uncover inconsistencies and anomalies in the data, ultimately enhancing data consistency and reliability.
Data: Provides a deeper dive into the actual content of your database, enabling detailed exploration and analysis of records. The screen features a SQL window where you can enter a WHERE clause to filter the data in the selected table.
Foreign Keys: Presents a clear view of relationships between tables, assisting you in understanding how data is interconnected across the database.
Together, these tabs provide a comprehensive suite of tools that empower you to effectively analyze your database.
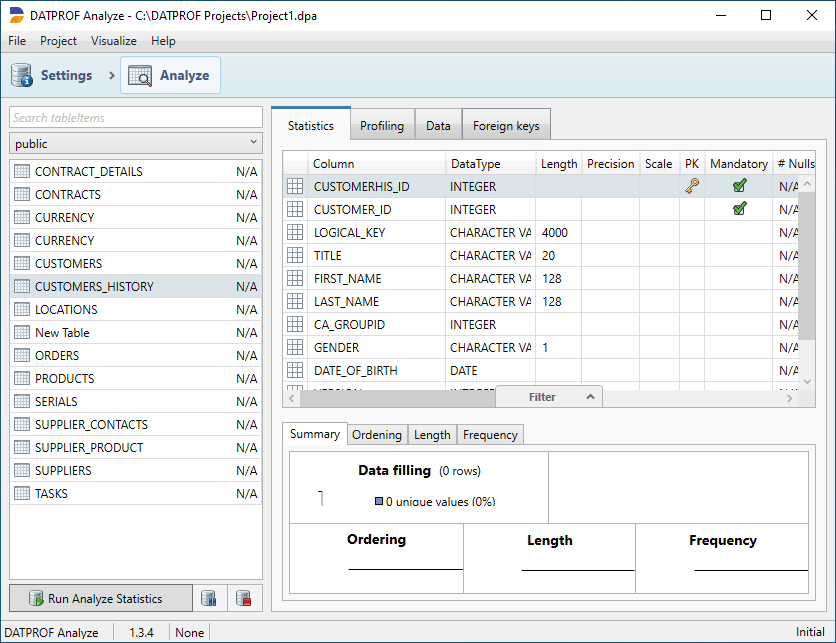
Statistics
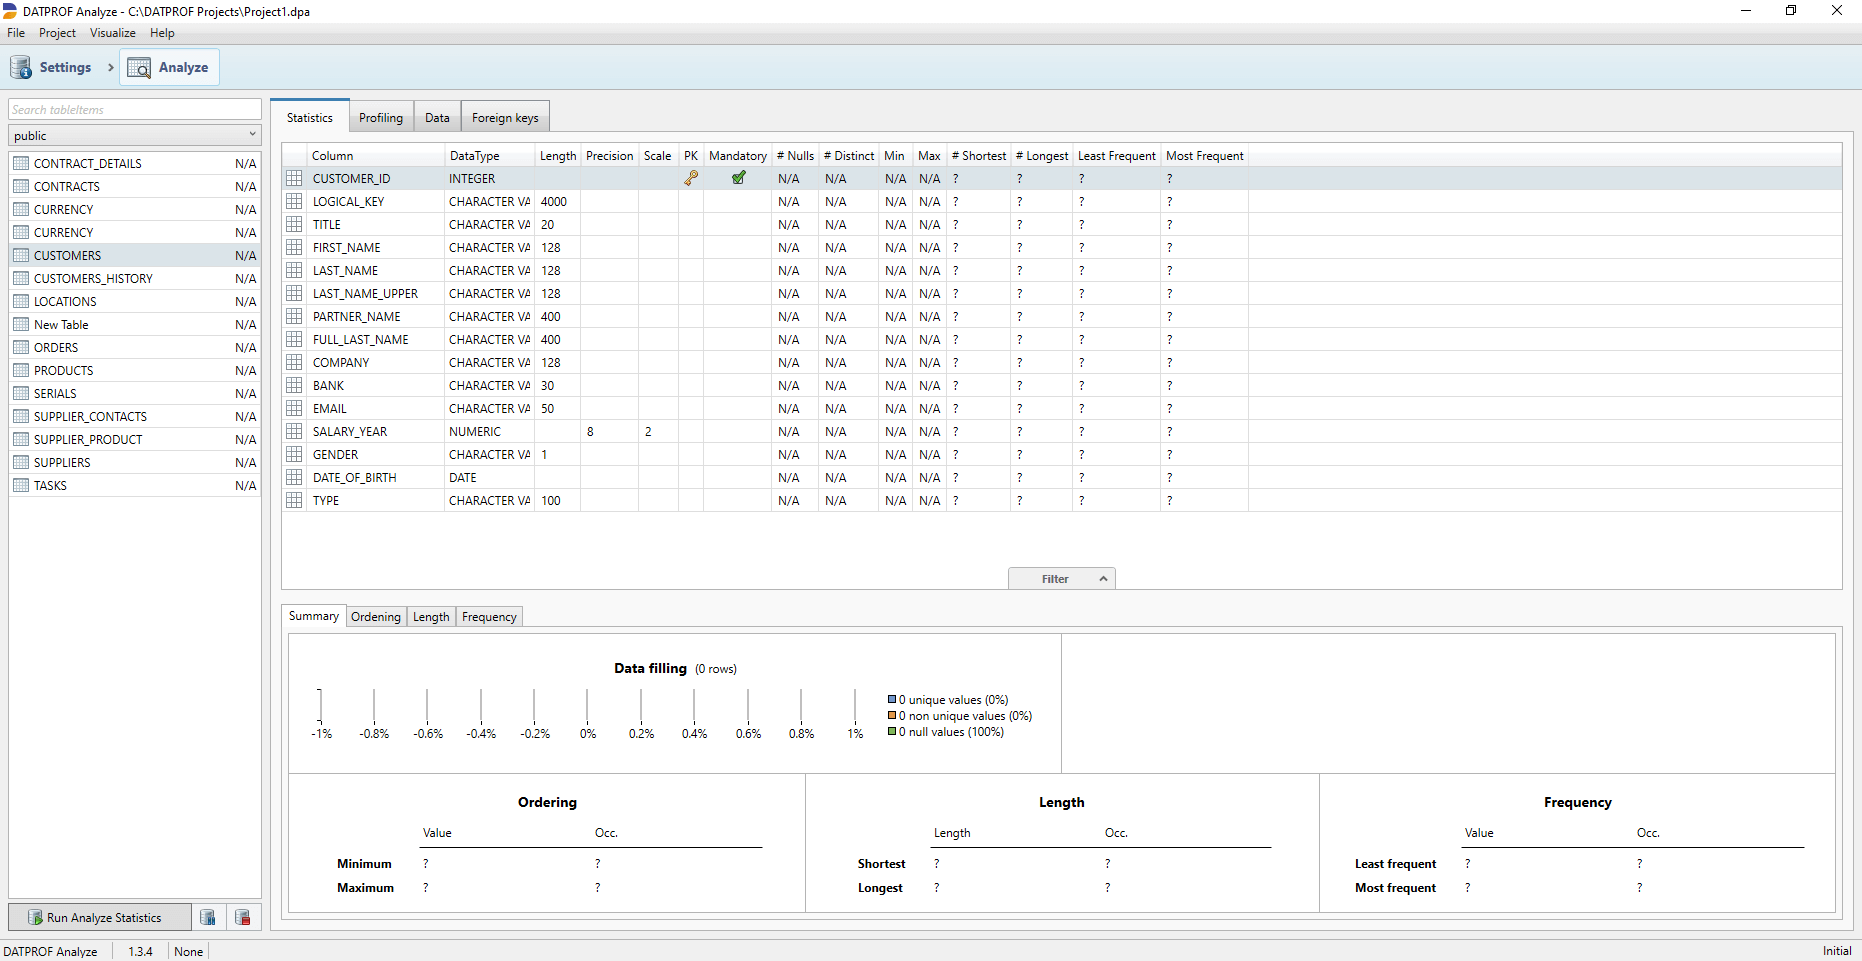
The Statistics tab provides statistical data for selected tables or views. Only the tables or views you select will be analyzed.
Certain column characteristics are displayed without requiring a full analysis. These are collected from the metadata imported during the Import meta data process and reflect the available data at that stage.
After an Analyze run, statistics are gathered from the data in the columns and displayed.
# Nulls: The amount of NULL values in this column.
# Distinct: The number of unique values in this column.
Min: Show the lowest value in this column ("A" is before "a", "-1" is before "1").
Max: Show the highest value in this column.
# Shortest: Show the shortest value in this column. For numeric also the shortest length is given where the the value 11 has the length 2 and the value -2 also has the length 2.
# Longest: Show the longest value in this column. For numeric also the shortest length is given where the the value 11 has the length 2 and the value -2 also has the length 2.
Least frequent: Show the least often occurring value in this column.
Most frequent: Show the most frequently occurring value in this column.
Filtering
To analyze the entire content of a table, simply select the table and click Run Statistics.
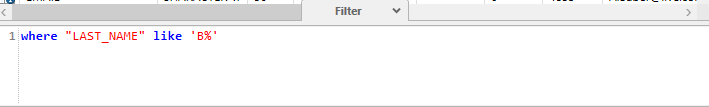
If you want to generate statistics for a specific subset of data, you can apply a filter. In the central part of the window, navigate to the Filter tab, where a text box will appear. Here, you can enter an SQL WHERE clause to define the desired data subset for analysis.
When running statistics with a filter applied, only the filtered data will be analyzed.
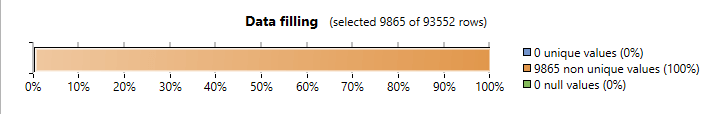
The resulting count is displayed in the Summary section under Data Filing.
A filter can be given for every table or view.
Filters are saved in the project.
Filters are NOT removed when clearing Statistic data.
The Number of records in the left panel still shows the total number of unfiltered records in this table.
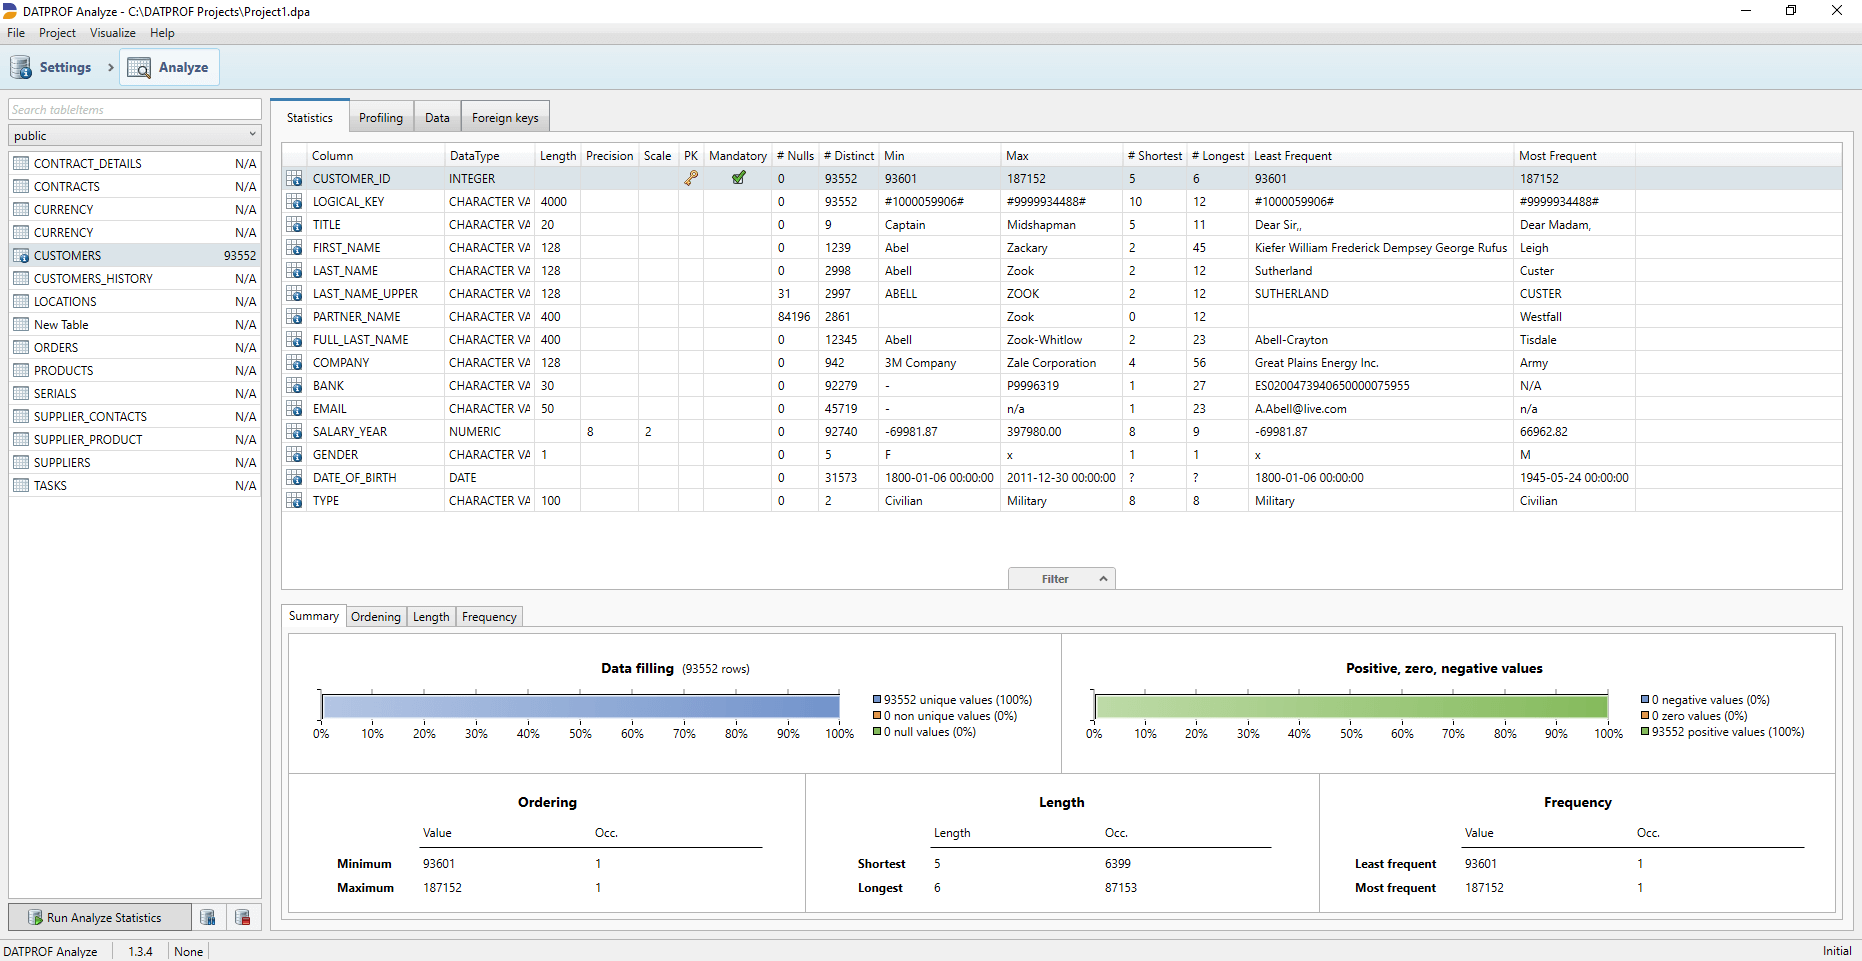
Summary
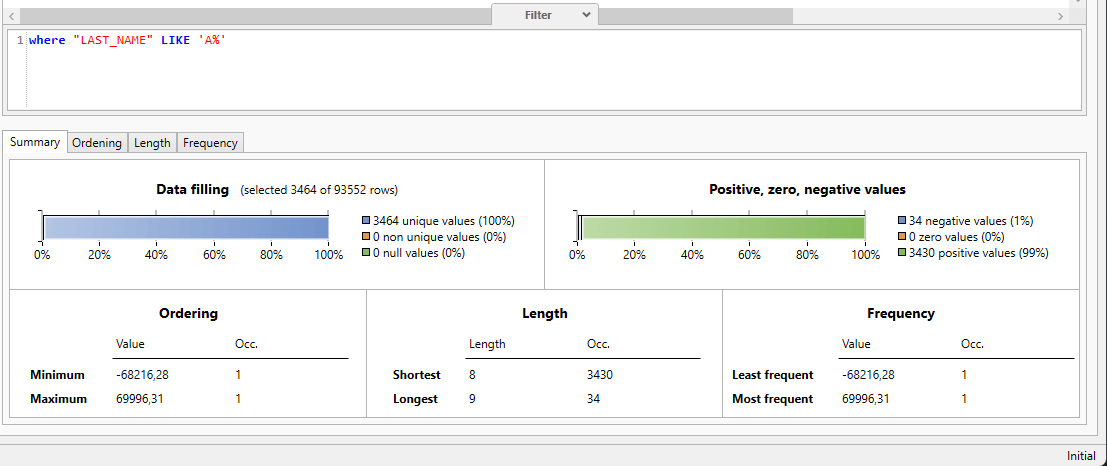
The summary tab shows either one or two diagrams depending on whether the table was filtered. The data filling diagram shows the filling of this column. The other diagram is only visible for Numeric columns. It shows the number of positive, negative and "0" records in this column.
Below the diagram part you find three blocks of information: Ordering, Length and Frequency.
For all three blocks you can see the most extreme results. The other tabs elaborate upon these results.
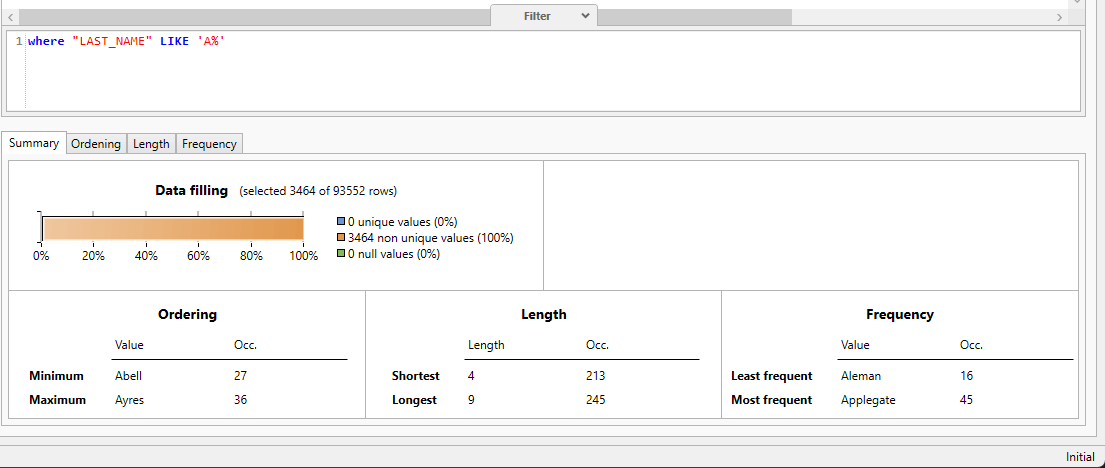
Below is an example of an alphanumeric and a numeric column, both filtered with the condition WHERE "LAST_NAME" LIKE 'A%' (meaning the last name value must start with the letter A):
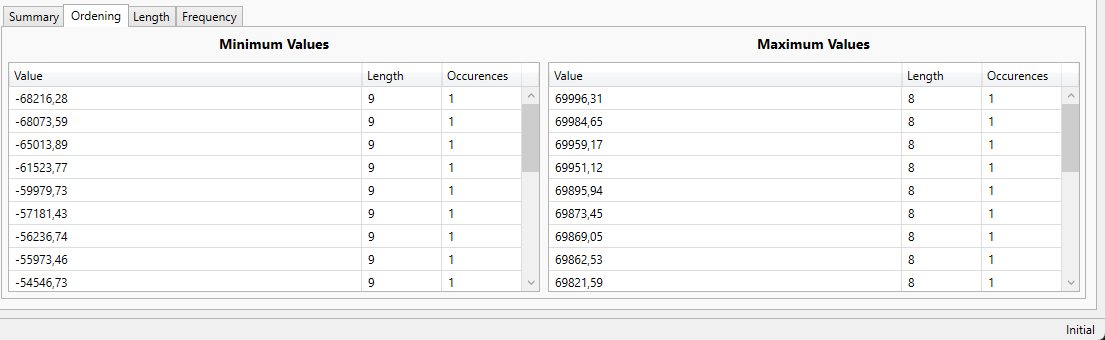
Ordening
This tab displays two panels: one for the minimum values and one for the maximum values. It shows the values (sorted from low to high and vice versa), along with their length and the number of occurrences.
Double-click on a record to view the corresponding result(s). You can modify the filter and re-run the query if you'd like to further refine the data you've found.
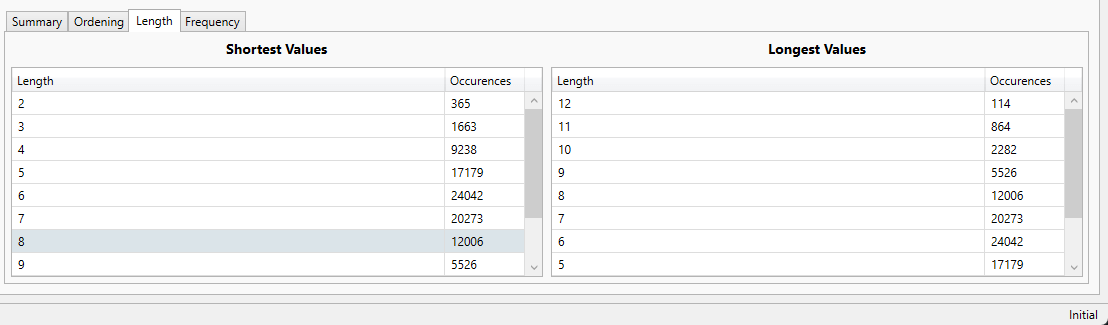
Length
This shows two panels. One for the shortest and one for the longest values. It shows also the number of occurrences.
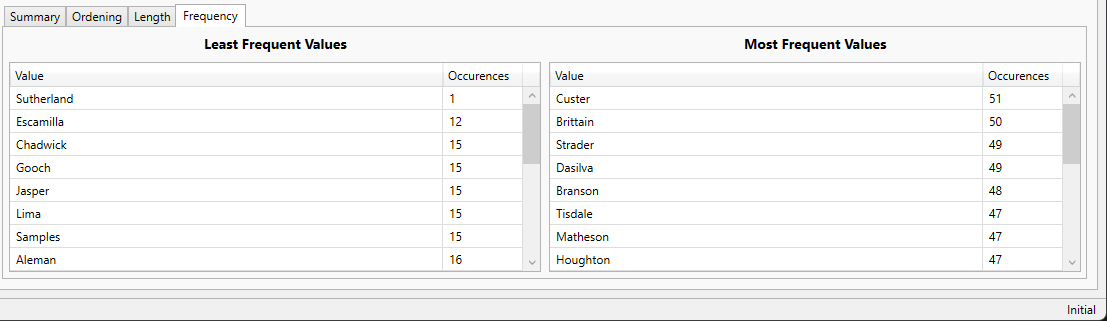
Frequency
In the frequency tab you can see which values occur most often and least often within a given table. In the Value column the actual value is shown, and in the Occurrences column the amount of times that value was encountered is shown.
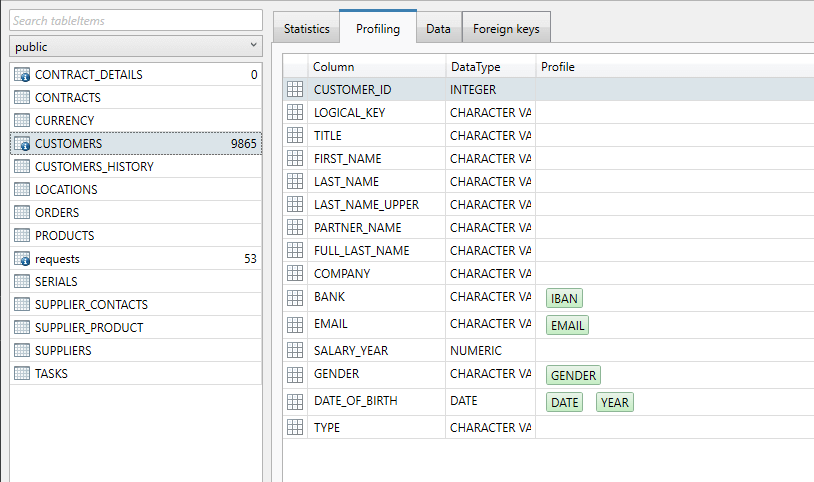
Profiling
The Profiling tab gives an oversight of which tables conform to the profiles we've configured earlier.
In the example below, the columns EMAIL and GENDER have matching profiles. This is entirely expected, as we can reasonably assume that a column named "EMAIL" will contain email addresses.
However, when dealing with abstract column names like ZGKLZ125 or ZGKLA124, the use of profiles becomes particularly valuable. Profiles help remove the abstraction, offering a clear understanding of what data is actually contained within these columns.
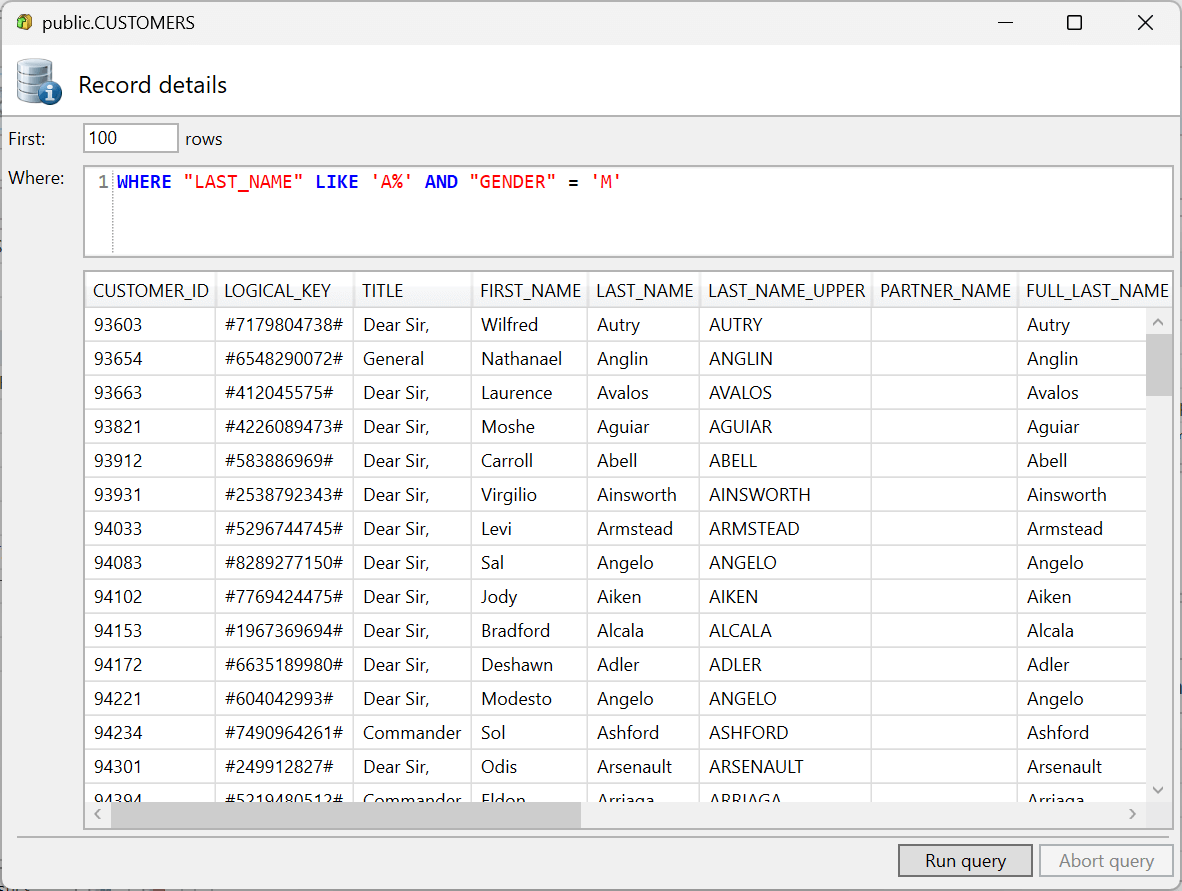
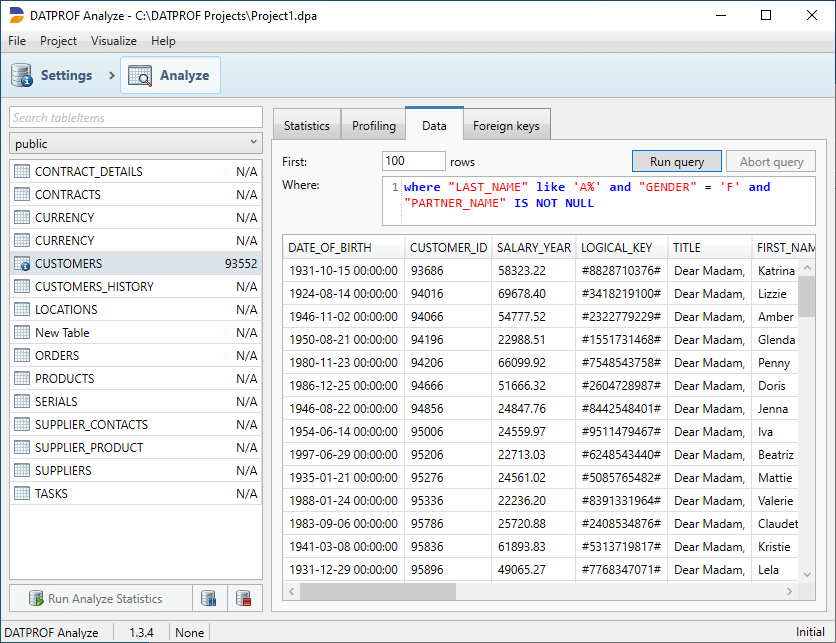
Data
This screen features a SQL window where you can enter a WHERE clause to filter the data in the selected table. The results are displayed in a grid, and you can sort the grid by clicking on the column headers.
By default, only 100 records are retrieved. Since all data is transferred to the client, increasing this value may lead to performance issues.
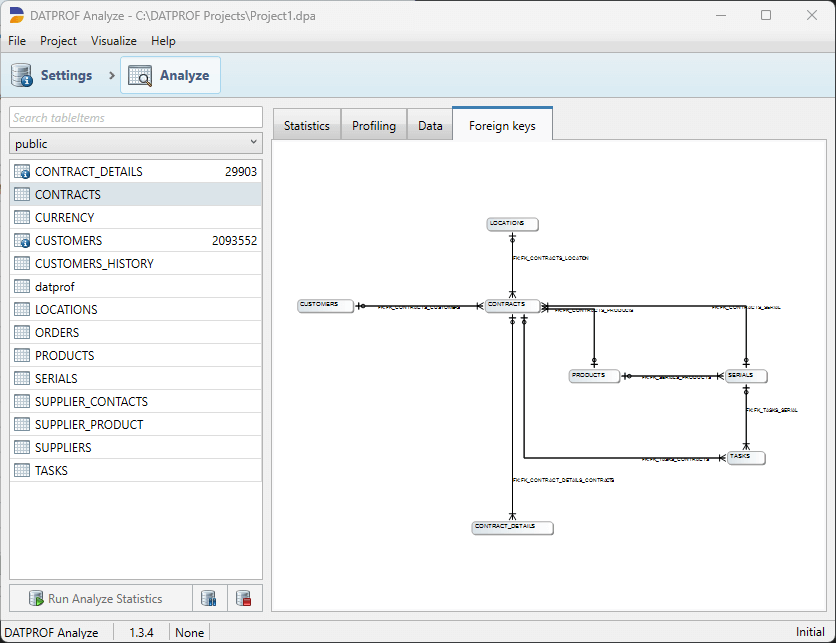
Foreign Keys
The Foreign Keys tab visualizes the existing foreign keys for the selected table. This information is readily available as it was retrieved through the Import Metadata and Sync Metadata options earlier.
JavaScript errors detected
Please note, these errors can depend on your browser setup.
If this problem persists, please contact our support.


 for tables
 for views